I've been using Intrvl consistently for the past month. Not as the founder testing features — as a lifter tracking every session, every set, every rest period.
Here's what my dashboard shows after 30 days of data. No cherry-picking sessions. No editing out the messy weeks. Just what happens when you track everything.
The numbers: one month of training
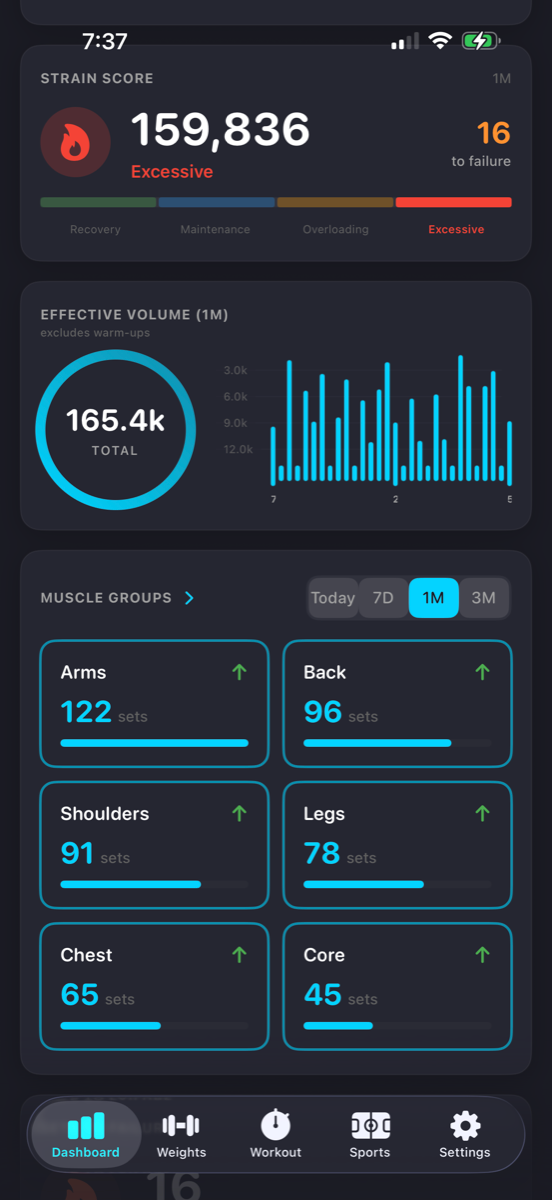
Strain Score: 159,836 (marked "Excessive") Effective Volume: 165,400kg (warm-ups excluded) Sets to failure: 16 across the month Total working sets: 597 (distributed across six muscle groups)
The Strain Score sits in the red. The app flagged it as "Excessive" immediately. That's the point — data that doesn't lie to you.
What "Excessive" means
Strain Score isn't volume. It weights exercises by muscle group size and accounts for intensity. Failure sets cost more than straight sets. Compound movements register higher than isolation work.
At 159,836 over 30 days, I'm running a significant recovery deficit. The app doesn't tell me to back off — it shows me the cost and lets me decide if it's worth paying.
This month, I'm deliberately pushing volume higher than sustainable. I know it. The dashboard confirms it. That's information I can use.
Volume distribution: where the work went
The Muscle Heatmap breaks down where training focus landed:
- Arms: 122 sets (20% of total volume)
- Back: 96 sets (16%)
- Shoulders: 91 sets (15%)
- Legs: 78 sets (13%)
- Chest: 65 sets (11%)
- Core: 45 sets (8%)
All six groups show upward trends across the month. That's progressive overload visualised. Not assumed, not estimated.
Arms got the most attention. This was planned — I'm bringing them up. Without the heatmap, I'd have guessed legs or back were taking priority. The data corrected that assumption. It also showed core is lagging. Even with compound lift involvement, it's a weak spot that needs fixing.
Effective Volume: what counted
165,400kg of Effective Volume over 30 days. Warm-ups excluded automatically because they don't contribute to muscle growth or strength gains. Only the hard sets count.
The daily volume chart shows variability — some sessions pushed 12,000kg, others sat around 4,000kg.
Higher volume days clustered mid-month when recovery was good. Lower volume days appeared when fatigue accumulated.
What 16 failure sets cost
Sixteen sets to failure across 597 total working sets. That's 2.7% of all work taken to absolute muscular failure.
Strain Score weights these heavily because failure sets demand disproportionate recovery. The algorithm accounts for this — regular sets contribute linearly, failure sets cost exponentially.
Those 16 sets didn't happen randomly. They appeared on isolation movements at the end of sessions when form risk was lowest and systemic fatigue was manageable.
Training density: time under load
The volume distribution chart shows another pattern: consistency. Training happened 24 out of 30 days this month.
Rest days appeared strategically — no more than two consecutive training days without a break early in the month, then three-day blocks later when volume climbed.
This is Training Density in practice. Volume-per-minute dropped slightly as the month progressed because rest periods lengthened when fatigue accumulated. That's what should happen under high-volume loading.
What the dashboard does
It doesn't coach. It doesn't suggest workouts. It doesn't tell you what to do next.
It shows you what you did, weights it accurately, and lets you decide if the pattern serves your goals.
The "Excessive" Strain Score isn't a warning — it's confirmation that the volume I'm running requires deliberate recovery management. I knew that from how I felt. The dashboard quantified it.
The Muscle Heatmap showed I'm prioritising arms over legs this block. That was intentional, but now it's visible. I can adjust or continue — either way, the choice is informed.
The Effective Volume total proves progressive overload is happening. Week-to-week volume climbed consistently. That's not a feeling — it's measured.
Why this matters
Most people training don't know what they did last session, let alone last month. They're guessing about progressive overload. They're estimating recovery needs. They're assuming balanced training distribution.
The dashboard eliminates assumptions.
You see where volume went. You see how hard you pushed. You see whether you're progressing or spinning wheels.
This month, I moved 165,400kg across 597 working sets. I took 16 sets to failure. I accumulated a Strain Score that sits deep in the red zone. Arms got 122 sets. Back got 96. Legs got 78.
I know this because I tracked it. Not because I remember it. Not because I estimated it. Because Intrvl calculated it from every rep I logged.
That's the difference between training on data and training on memory.
What's next
Next month's dashboard will show different numbers. Strain Score might drop back into "Overloading" range as volume moderates. Leg volume might climb to balance the heatmap. Failure sets might increase or decrease depending on programming.
The point isn't hitting perfect numbers. The point is knowing what the numbers are — so you can train deliberately instead of accidentally.
Time every interval. Track every lift. Know what works.
That's not marketing. That's what the dashboard shows after one month of consistent logging.
Try Intrvl free for 7 days. $39.99/year or $79.99 lifetime. No ads. All analytics included.